Histogram
Histogram
| Histogram | |
|---|---|
 |
Video: What is a Histogram?
What is a histogram?
A histogram is an accurate representation of the distribution of numerical data. It is an estimate of the probability distribution of a continuous variable (quantitative variable) and was first introduced by Karl Pearson.
How does a histogram differ from a bar graph?
Histogram differs from a bar graph, in the sense that a bar graph relates two variables, but a histogram relates only one. Histograms are sometimes confused with bar charts. A histogram is used for continuous data, whereas the bins represent ranges of data, while a bar chart is a plot of categorical variables. Some authors recommend that bar charts have gaps between the rectangles to clarify the distinction.
Video: How a histogram is different than a bar chart?
How do you construct a histogram?
To construct a histogram, the first step is to "bin" (or "bucket") the range of values—that is, divide the entire range of values into a series of intervals—and then count how many values fall into each interval. The bins are usually specified as consecutive, non-overlapping intervals of a variable. The bins (intervals) must be adjacent, and are often (but are not required to be) of equal size.
Video: Statistics - How to make a histogram
Is a histogram used in quality control?
Yes, the histogram is one of the seven basic tools of quality control.
Video: When to Use Histograms
Example of a histogram
This is the data for the histogram to the right, using 500 items:
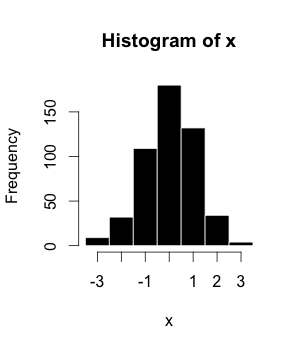
| Bin | Count |
|---|---|
| −3.5 to -2.51 | 9 |
| −2.5 to -1.51 | 32 |
| −1.5 to -0.51 | 109 |
| −0.5 to 0.49 | 180 |
| 0.5 to 1.49 | 132 |
| 1.5 to 2.49 | 34 |
| 2.5 to 3.49 | 4 |
Video: Statistics - Reading the shape of a distribution
What are the different patterns one can see in a histogram?
The words used to describe the patterns in a histogram are: "symmetric", "skewed left" or "right", "unimodal", "bimodal" or "multimodal".
-

Symmetric, unimodal
-

Skewed right
-

Skewed left
-

...........
NOTE: You need to be subscribed to either a monthly or annual plan to view the full set of Math Lessons (Study Guide)
Please visit to register for a plan.
Let's Review
- A _________ is an accurate representation of the distribution of numerical data.
- A histogram is an estimate of the _________ distribution of a continuous variable (quantitative variable)
- Histogram differs from a bar graph, in the sense that a bar graph relates _________ variables, but a histogram relates only _________.
- A histogram is used for _________ data, whereas the bins represent _________ of data, while a bar chart is a plot of categorical variables.
- Histogram is one of the seven basic tools of _________ _________.
- The different patterns that can be seen in a histogram are "_________", "_________ _________ _________ " or "_________", "_________", "_________" or "_________".
- Histograms give a rough sense of the _________ of the underlying distribution of the data.
Answer
- A histogram is an accurate representation of the distribution of numerical data.
- A histogram is an estimate of the probability distribution of a continuous variable (quantitative variable)
- Histogram differs from a bar graph, in the sense that a bar graph relates two variables, but a histogram relates only one.
- A histogram is used for continuous data, whereas the bins represent ranges of data, while a bar chart is a plot of categorical variables.
- Histogram is one of the seven basic tools of quality control.
- The different patterns that can be seen in a histogram are "symmetric", "skewed left" or "right", "unimodal", "bimodal" or "multimodal".
- Histograms give a rough sense of the density of the underlying distribution of the data.
Test Your Knowledge
‹ Bar graph video up Histogram video ›