The mean of a set of numbers is the sum of the numbers in the set divided by the number of values in that set
Median
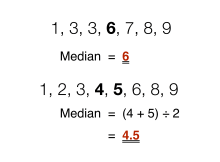
Given a set of numbers, the median is the middle number in that set when the numbers are arranged in an ascending (smallest to the largest) order. For a set with an even number of values, the average of the two middle numbers is taken
Mode
is the number that appears most frequently in a given set
.....
.......
Tips
Graphs
Use a bar graph to compare data
Use a line graph to show trends over time
Circle graph is used to show the parts of a whole. The percentages add up to 100%
Use a scatter plot to show trends when the data points are not connected
The mode of a set of data values is the value that appears most often. It is the value x at which its probability mass function takes its maximum value. In other words, it is the value that is most likely to be sampled.
Video: How to find the mode of a set of numbers.
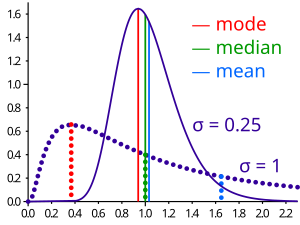
Like the statistical mean and median, the mode is a way of expressing, in a (usually) single number, important information about a random variable or a population. The numerical value of the mode is the same as that of the mean and median in a normal distribution, and it may be very different in highly skewed distributions.
Mode of a sample
The mode of a sample is the element that occurs most often in the collection. For example, the mode of the sample [1, 3, 6, 6, 6, 6, 7, 7, 12, 12, 17] is 6. Given the list of data [1, 1, 2, 4, 4] the mode is not unique – the dataset may be said to be bimodal, while a set with more than two modes may be described as multimodal.
Comparison of mean, median and mode
Geometric visualisation of the mode, median and mean of an arbitrary probability density function.
Video: What are Mean, Median and Mode?
Comparison of common averages of values { 1, 2, 2, 3, 4, 7, 9 }
Type
Description
Example
Result
Arithmetic mean
Sum of values of a data set divided by number of values:
In statistics, the standard deviation (SD, also represented by the Greek letter sigma σ or the Latin letter s) is a measure that is used to quantify the amount of variation or dispersion of a set of data values.
Video: How to Calculate Standard Deviation
A low standard deviation indicates that the data points tend to be close to the mean (also called the expected value) of the set, while a high standard deviation indicates that the data points are spread out over a wider range of values.
The standard deviation of a random variable, statistical population, data set, or probability distribution is the square root of its variance. It is algebraically simpler, though in practice less robust, than the average absolute deviation. A useful property of the standard deviation is that, unlike the variance, it is expressed in the same units as the data.
Basic examples
Sample standard deviation of metabolic rate of Northern Fulmars
Logan gives the following example. Furness and Bryantmeasured the resting metabolic rate for 8 male and 6 female breeding Northern fulmars. The table shows the Furness data set.
Furness data set on metabolic rates of Northern fulmars
Sex
Metabolic rate
Sex
Metabolic rate
Male
525.8
Female
727.7
Male
605.7
Female
1086.5
Male
843.3
Female
1091.0
Male
1195.5
Female
1361.3
Male
1945.6
Female
1490.5
Male
2135.6
Female
1956.1
Male
2308.7
Male
2950.0
The graph shows the metabolic rate for males and females. By visual inspection, it appears that the variability of the metabolic rate is greater for males than for females.
The graph shows the metabolic rate for males and females. By visual inspection, it appears that the variability of the metabolic rate is greater for males than for females.
The sample standard deviation of the metabolic rate for the female fulmars is calculated as follows. The formula for the sample standard deviation is
where are the observed values of the sample items, is the mean value of these observations, and N is the number of observations in the sample.
In the sample standard deviation formula, for this example, the numerator is the sum of the squared deviation of each individual animal's metabolic rate from the mean metabolic rate. The table below shows the calculation of this sum of squared deviations for the female fulmars. For females, the sum of squared deviations is 886047.09, as shown in the table.
A quartile is a type of quantile. The first quartile (Q1) is defined as the middle number between the smallest number and the median of the data set. The second quartile (Q2) is the median of the data. The third quartile (Q3) is the middle value between the median and the highest value of the data set.
In applications of statistics such as epidemiology, sociology and finance, the quartiles of a ranked set of data values are the four subsets whose boundaries are the three quartile points. Thus an individual item might be described as being "in the upper quartile".
Definitions
Boxplot (with quartiles and an interquartile range) and a probability density function (pdf) of a normal N(0,1σ2) population
Symbol
Names
Definition
Q1
first quartile
lower quartile
25th percentile
splits off the lowest 25% of data from the highest 75%
Q2
second quartile
median
50th percentile
cuts data set in half
Q3
third quartile
upper quartile
75th percentile
splits off the highest 25% of data from the lowest 75%
Computing methods
For discrete distributions, there is no universal agreement on selecting the quartile values.[1]
Method 1
Use the median to divide the ordered data set .....
The median is the value separating the higher half of a data sample, a population, or a probability distribution, from the lower half.
For a data set, it may be thought of as the "middle" value. For example, in the data set {1, 3, 3, 6, 7, 8, 9}, the median is 6, the fourth largest, and also the fourth smallest, number in the sample. For a continuous probability distribution, the median is the value such that a number is equally likely to fall above or below it.
Video: Median of a Triangle
Finding the median in sets of data with an odd and even number of values
The median is a commonly used measure of the properties of a data set in statistics and probability theory. The basic advantage of the median in describing data compared to the mean (often simply described as the "average") is that it is not skewed so much by extremely large or small values, and so it may give a better idea of a "typical" value. For example, in understanding statistics like household income or assets which vary greatly, a mean may be skewed by a small number of extremely high or low values. Median income, for example, may be a better way to suggest what a "typical" income is.
Because of this, the median is of central importance in robust statistics, as it is the most resistant statistic, having a breakdown point of 50%: so long as no more than half the data are contaminated, the median will not give an arbitrarily large or small result.
Finite set of numbers
The median of a finite list of numbers can be found by arranging all the numbers from smallest to greatest.
If there is an odd number of numbers, the middle one is picked. For example, ......
In colloquial language, an average is a middle or typical number of a list of numbers.
Video: Math Help : How to Calculate an Average
Different concepts of average are used in different contexts. Often "average" refers to thearithmetic mean, the sum of the numbers divided by how many numbers are being averaged. In statistics, mean,median, andmodeare all known asmeasuresofcentral tendency, and in colloquial usage sometimes any of these might be called an average value.
Arithmetic mean
The most common type of average is the arithmetic mean.
Video: What is the Arithmetic Mean?
Ifnnumbers are given, each number denoted byai(wherei = 1,2, …, n), the arithmetic mean is thesumof theas divided bynor
The arithmetic mean, often simply called the mean, of two numbers, such as 2 and 8, is obtained by finding a value A such that 2 + 8 = A + A. One may find thatA= (2 + 8)/2 = 5. Switching the order of 2 and 8 to read 8 and 2 does not change the resulting value obtained for A. The mean 5 is not less than the minimum 2 nor greater than the maximum 8. If we increase the number of terms in the list to 2, 8, and 11, the arithmetic mean is found by solving for the value ofAin the equation 2 + 8 + 11 = A + A + A. One finds thatA= (2 + 8 + 11)/3 = 7.
The most frequently occurring number in a list is called the mode.
Video: The Mean, Median and Mode Toads
For example, the mode of the list (1, 2, 2, 3, 3, 3, 4) is 3. It may happen that there are two or more numbers which occur equally often and more often than any other number. In this case there is no agreed definition of mode. Some authors say they are all modes and some say there is no mode.
Median
The median is the middle number of the group when they are ranked in order. (If there are an even number of numbers, the mean of the middle two is taken.)
Video: Statistics - Find the median
Thus to find the median, order the list according .....


 are the observed values of the sample items,
  is the mean value of these observations, and N is the number of observations in the sample.