Hello Science Genie. Let's now learn about the scatter plot. A scatter plot is a type of plot or mathematical diagram using Cartesian coordinates and is used to display values for typically two variables for a set of data. If the points are color-coded, one additional variable can be displayed in the scatter plot. The data are displayed as a collection of points. Each point has the value of one variable determining the position on the horizontal axis and the value of the other variable determining the position on the vertical axis.
What are the other names for a scatter plot?
A scatter plot is also called a scatterplot, scatter graph, scatter chart, scattergram, or scatter diagram.
Video: Constructing a scatter plot | Regression
Scatter plot
First described by
John Herschel
Purpose
To identify the type of relationship (if any) between two quantitative variables
Let us look at a Scatter Plot example
For example, to display a link between a person's lung capacity, and how long that person could hold his/her breath, a researcher would choose a group of people to study, then measure each one's lung capacity (first variable) and how long that person could hold his/her breath (second variable). The researcher would then plot the data in a scatter plot, assigning "lung capacity" to the horizontal axis, and "time holding breath" to the vertical axis.
A person with a lung capacity of 400 cl who held his/her breath for 21.7 seconds would be represented by a single dot on the scatter plot at the point (400, 21.7) in the Cartesian coordinates. The scatter plot of all the people in the study would enable the researcher to obtain a visual comparison of the two variables in the data set, and will help to determine what kind of relationship there might be between the two variables.
Video: Studying, shoe size, and test scores scatter plots
Overview
What are dependent and independent variables?
A scatter plot can be used either when one continuous variable is under the control of the experimenter and the other depends on it or when both continuous variables are independent. If a parameter exists that is systematically incremented and/or decremented by the other, it is called the control parameteror independent variable and is customarily plotted along the horizontal axis. The measured or dependent variable is customarily plotted along the vertical axis. If no dependent variable exists, either type of variable can be plotted on either axis and a scatter plot will illustrate only the degree of correlation (not causation) between two variables.
Video: Scatterplots and Correlations
What is a Correlation?
A scatter plot can suggest various kinds of correlations between variables with a certain confidence interval. For example, weight and height, weight would be on y axis and height would be on the x axis. Correlations may be positive (rising), negative (falling), or null (uncorrelated).
How to identify a positive correlation?
If the pattern of dots slopes from lower left to upper right, it indicates a positive ................
...............
NOTE: You need to be subscribed to either a monthly or annual plan to view the full set of Math Lessons (Study Guide)
Please visit to register for a plan.
Let's Review
A ___________ is a type of plot or mathematical diagram using Cartesian coordinates and is used to display values for typically two variables for a set of data.
A scatter plot is also called a ___________ , ___________ , ___________ , ___________ or ___________
The measured or dependent variable is customarily plotted along the ___________ axis.
___________ may be positive (rising), negative (falling), or null (uncorrelated).
If the pattern of dots slopes from lower left to upper right, it indicates a ___________ correlation between the variables being studied.
A line of best fit (alternatively called '___________ ') can be drawn in order to study the relationship between the variables.
For a linear correlation, the best-fit procedure is known as ___________ ___________ and is guaranteed to generate a correct solution in a finite time.
Scatter diagram is one of the seven basic tools of ___________ ___________.
Scatter charts can be built in the form of ___________, ___________, or/and ___________.
Answer
A scatter plotis a type of plot or mathematical diagram using Cartesian coordinates and is used to display values for typically two variables for a set of data.
A scatter plot is also called a scatterplot, scatter graph, scatter chart, scattergram, or scatter diagram.
The measured or dependent variable is customarily plotted along the vertical axis.
Correlations may be positive (rising), negative (falling), or null (uncorrelated).
If the pattern of dots slopes from lower left to upper right, it indicates a positive correlation between the variables being studied.
A line of best fit (alternatively called 'trendline') can be drawn in order to study the relationship between the variables.
For a linear correlation, the best-fit procedure is known as linear regression and is guaranteed to generate a correct solution in a finite time.
Scatter diagram is one of the seven basic tools of quality control.
Scatter charts can be built in the form of bubble, marker, or/and line charts.
A histogram is an accurate representation of the distribution of numerical data. It is an estimate of the probability distribution of a continuous variable (quantitative variable) and was first introduced by Karl Pearson.
How does a histogram differ from a bar graph?
Histogram differs from a bar graph, in the sense that a bar graph relates two variables, but a histogram relates only one. Histograms are sometimes confused with bar charts. A histogram is used for continuous data, whereas the bins represent ranges of data, while a bar chart is a plot of categorical variables. Some authors recommend that bar charts have gaps between the rectangles to clarify the distinction.
Video: How a histogram is different than a bar chart?
How do you construct a histogram?
To construct a histogram, the first step is to "bin" (or "bucket") the range of values—that is, divide the entire range of values into a series of intervals—and then count how many values fall into each interval. The bins are usually specified as consecutive, non-overlapping intervals of a variable. The bins (intervals) must be adjacent, and are often (but are not required to be) of equal size.
Video: Statistics - How to make a histogram
Is a histogram used in quality control?
Yes, the histogram is one of the seven basic tools of quality control.
Video: When to Use Histograms
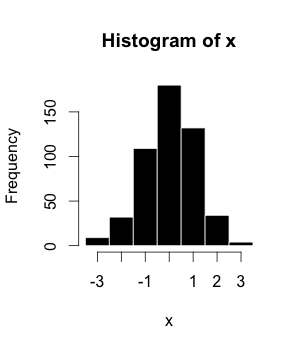
Example of a histogram
This is the data for the histogram to the right, using 500 items:
Bin
Count
−3.5 to -2.51
9
−2.5 to -1.51
32
−1.5 to -0.51
109
−0.5 to 0.49
180
0.5 to 1.49
132
1.5 to 2.49
34
2.5 to 3.49
4
Video: Statistics - Reading the shape of a distribution
What are the different patterns one can see in a histogram?
The words used to describe the patterns in a histogram are: "symmetric", "skewed left" or "right", "unimodal", "bimodal" or "multimodal".
Symmetric, unimodal
Skewed right
Skewed left
...........
NOTE: You need to be subscribed to either a monthly or annual plan to view the full set of Math Lessons (Study Guide)
Please visit to register for a plan.
Let's Review
A _________ is an accurate representation of the distribution of numerical data.
A histogram is an estimate of the _________ distribution of a continuous variable (quantitative variable)
Histogram differs from a bar graph, in the sense that a bar graph relates _________ variables, but a histogram relates only _________.
A histogram is used for _________ data, whereas the bins represent _________ of data, while a bar chart is a plot of categorical variables.
Histogram is one of the seven basic tools of _________ _________.
The different patterns that can be seen in a histogram are "_________", "_________ _________ _________ " or "_________", "_________", "_________" or "_________".
Histograms give a rough sense of the _________ of the underlying distribution of the data.
Answer
A histogramis an accurate representation of the distribution of numerical data.
A histogram is an estimate of the probability distribution of a continuous variable (quantitative variable)
Histogram differs from a bar graph, in the sense that a bar graph relates two variables, but a histogram relates only one.
A histogram is used for continuous data, whereas the bins represent ranges of data, while a bar chart is a plot of categorical variables.
Histogram is one of the seven basic tools of qualitycontrol.
The different patterns that can be seen in a histogram are "symmetric", "skewed left" or "right", "unimodal", "bimodal" or "multimodal".
Histograms give a rough sense of the density of the underlying distribution of the data.
A line chart or line graph is a type of chart which displays information as a series of data points called 'markers' connected by straight line segments. It is a basic type of chart common in many fields.
How is a line chart different from a scatter plot?
A line chart is similar to a scatter plot except that the measurement points are ordered (typically by their x-axis value) and joined with straight line segments.
What is line chart is used for?
A line chart is often used to visualize a trend in data over intervals of time – a time series – thus the line is often drawn chronologically. In these cases they are known as run charts.
Video: Learning about Line Graphs
Example of a Line Chart
In the experimental sciences, data collected from experiments are often visualized by a graph. For example, ................
NOTE: You need to be subscribed to either a monthly or annual plan to view the full set of Math Lessons (Study Guide)
Please visit to register for a plan.
Let's Review
A ________ ________ or ________ ________ is a type of chart which displays information as a series of data points called '________ ' connected by straight line segments.
A line chart is similar to a scatter plot except that the measurement points are ordered (typically by their x-axis value) and joined with ______ ______ segments.
A line chart is often used to visualize a ___________ in data over intervals of time – a time series – thus the line is often drawn chronologically.
When line charts are drawn as a time series, they are also known as ___________ charts.
Answer
A linechart or linegraph is a type of chart which displays information as a series of data points called 'markers' connected by straight line segments.
A line chart is similar to a scatter plot except that the measurement points are ordered (typically by their x-axis value) and joined with straightline segments.
A line chart is often used to visualize a trend in data over intervals of time – a time series – thus the line is often drawn chronologically.
When line charts are drawn as a time series, they are also known as run charts.
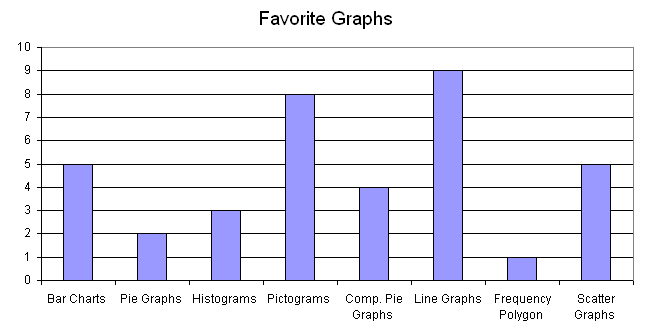
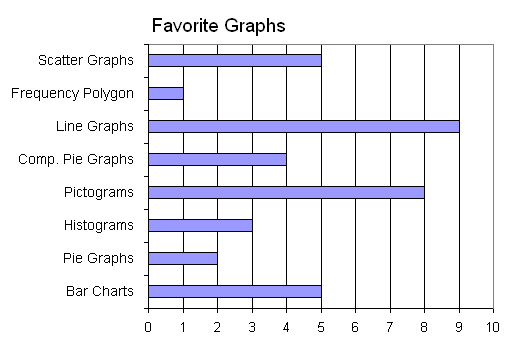
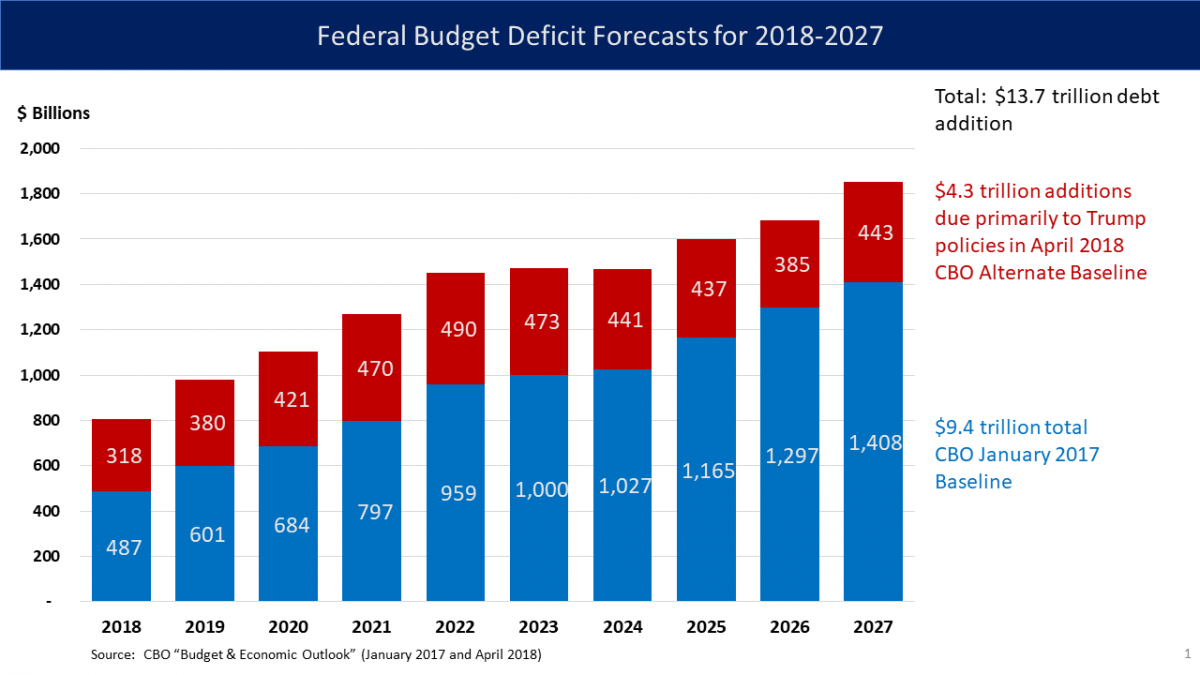
A bar chart or bar graph is a chart or graph that presents categorical data with rectangular bars with heights or lengths proportional to the values that they represent. The bars can be plotted vertically or horizontally. A vertical bar chart is sometimes called a line graph.
Veritcal Bar Chart (also known as Line Graph)
A bar graph shows comparisons among discrete categories. One axis of the chart shows the specific categories being compared, and the other axis represents a measured value. Some bar graphs present bars clustered in groups of more than one, showing the values of more than one measured variable.
Bar charts have a discrete domain of categories, and are usually scaled so that all the data can fit on the chart. When there is no natural ordering of the categories being compared, bars on the chart may be arranged in any order.
How to read a bar chart?
How to Make a Bar Graph in Excel?
What are the different types of bar charts?
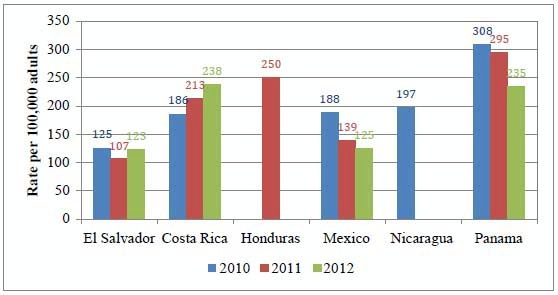
The different types of bar charts are horizontal, vertical, grouped, or stacked bar charts.
Horizontal Bar Charts
Grouped Bar Chart
Stacked Bar Chart
What are Pareto ........
.......
NOTE: You need to be subscribed to either a monthly or annual plan to view the full set of Math Lessons (Study Guide)
Please visit to register for a plan.
Let's Review
A ___ ___ or ___ ___ is a chart or graph that presents categorical data with rectangular bars with heights or lengths proportional to the values that they represent.
A vertical bar chart is sometimes called a ___ ___ .
A bar graph shows comparisons among discrete ___.
One axis of the chart shows the specific ___ being compared, and the other axis represents a measured ___ .
The different types of bar charts are ___ , ___ , ___ , or ___ bar charts.
Bar charts arranged from highest to lowest incidence are called ___ charts.
In a column bar chart, the ___ appear along the horizontal axis; the height of the bar corresponds to the ___ of each category.
Bar graphs can also be used for more complex comparisons of data with ___ bar charts and ___ bar charts.
In a ___ bar chart, for each categorical group there are two or more bars.
The ___ bar chart stacks bars that represent different groups on top of each other. The ___ of the resulting bar shows the combined result of the groups.
Stacked bar charts are not suited to datasets where some groups have negative values. In such cases, ___ bar chart are preferable.
Answer
A barchartor bar graph is a chart or graph that presents categorical data with rectangular bars with heights or lengths proportional to the values that they represent.
A vertical bar chart is sometimes called a linegraph.
A bar graph shows comparisons among discrete categories.
One axis of the chart shows the specific categoriesbeing compared, and the other axis represents a measured value.
The different types of bar charts are horizontal,vertical,grouped, or stacked bar charts.
Bar charts arranged from highest to lowest incidence are called Paretocharts.
In a column bar chart, the categoriesappear along the horizontal axis; the height of the bar corresponds to the valueof each category.
Bar graphs can also be used for more complex comparisons of data with groupedbar charts and stackedbar charts.
In a groupedbar chart, for each categorical group there are two or more bars.
The stackedbar chart stacks bars that represent different groups on top of each other. The heightof the resulting bar shows the combined result of the groups.
Stacked bar charts are not suited to datasets where some groups have negative values. In such cases, groupedbar chart are preferable.